Improving Reliability with Multiple ROI Streams
Modernizing power distribution with advanced analytics and intelligent line sensors
Technologies that can simultaneously tackle multiple aspects of grid reliability should be a top grid modernization investment priority for utilities — especially given the pressing need to reliably deliver power while overcoming a complex set of challenges.
The distribution system accounts for 92% of all electric service interruptions, a result of aging infrastructure, severe weather events and other third-party causes. In addition, increasing electrification and adoption of DERs and EVs has created new demands and challenges.
Each of these issues create power delivery challenges. Utilities seek solutions to effectively manage today’s problematic realities and improve reliability.
Addressing several power delivery challenges with a multi-pronged solution enables multiple returns on investment (ROI) with a variety of grid reliability use cases. Intelligent line sensing with analytics is one such technology solution offering a variety of concurrent use cases, and enabling utilities to pursue multiple ROI streams and quickly justify the expenditure.
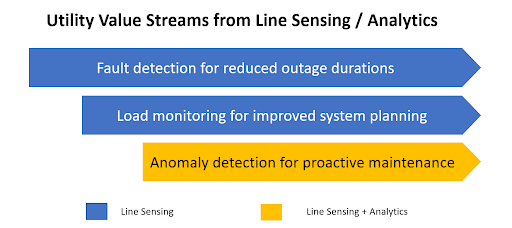
Expanded system visibility and insights from data provided by intelligent line sensors set utilities up to benefit in three ways, the third made possible through advanced analytics and machine learning:
- Enhanced fault detection with more precise location
- Load monitoring for improved system planning
- Anomaly detection for proactive maintenance
Each of these use cases becomes a value stream when utilities use line sensor data to improve work processes and outcomes. A grid reliability solution with several concurrent value streams versus a single-target technology allows for stronger ROI with quicker payback and more customer benefit.
Value Stream #1 – Fault Detection and Location for Reduced Outage Durations
Overhead and underground line sensors provide enhanced system visibility in more locations along feeders and laterals. With remote communications that provide visibility to the control center, these devices can be installed on overhead lines, underground cables in pad mounted or vault switches, and in underground residential (URD) transformers.
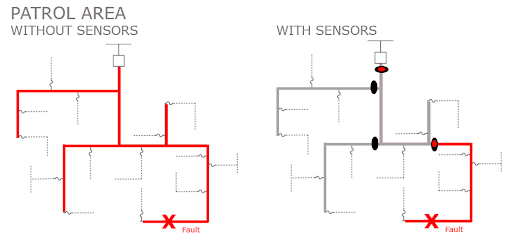
When utilities have a more granular view of their system, patrol areas are narrowed, and crews are better equipped to address the fault. Line sensors and communicating faulted circuit indicators (FCIs) are a proven method to improve utility reliability metrics such as outage durations, system average interruption duration index (SAIDI), and operations and maintenance (O&M) costs.
Although line sensor data can be integrated with existing utility fault-finding processes in several ways, the simplest approach is to use line sensing software to visualize the locations of fault indications and manually overlay this with SCADA/OMS/DMS data. Direct integration of sensor data with utility SCADA, OMS, and DMS systems for a holistic view of system status is an even more streamlined method. Line sensing software must be flexible and have APIs to enable this integration.
Integrating sensor data with advanced distribution management system (ADMS) applications like fault location isolation and service restoration (FLISR/FDIR/FISR) or distance-to-fault calculations takes the effectiveness of reliability improvement efforts a step further. With the FLISR scenario, sensors are paired with non-communicating reclosers or feeder relays allowing these devices to participate in FLISR schemes — delivering dramatic SAIDI reductions.
As soon as line sensors are installed, they can help utilities detect and locate faults to reduce outage durations on those feeders and laterals. And when sensor data is integrated with supervisory control and data acquisition (SCADA) or ADMS applications, the value of sensor data increases — accelerating time-to-value.
Utilities typically see improvements of 20% or more in Customer Minutes Interrupted (CMI) on feeders with line sensing deployments. The improvement is largely due to a significant reduction in patrol time, with some utilities reporting upwards of 65% patrol time savings. Reducing patrol time also saves O&M costs. In fact, a large utility in the southeast reports that line sensing has yielded an 11% reduction in O&M costs.
Value Stream #2 – Load Monitoring for Improved System Planning
System planning teams don’t always have load data for the locations they need to make the most effective planning decisions. Visibility of system load at additional points on the system provided by intelligent line sensors can fill in these data gaps. This is especially important as DERs and EVs are increasingly added to power networks — creating significant changes in historic load curves and making load forecasting much more complex. Relying on load data from the substation alone is no longer sufficient.
Accurate load data from more system locations is essential for longer term capacity planning. And, in the shorter term, load data is also critical for switching decisions during an outage to ensure that circuits taking on new load do not become overloaded.
Yet another valuable benefit of visibility into system load data relates to system tuning. While the three phases of a feeder may look balanced at the substation, they can become significantly unbalanced at locations down the feeder. For example, in the graph below planners can identify a location with phase imbalance and initiate action to rebalance the phases of the feeder to gain efficiency and reliability.

Current supply chain constraints and lengthy wait times for critical equipment now make what was once a commonly accepted practice of run-to-failure, a risky approach to asset management. This, coupled with increased pressure for better grid reliability, necessitates a more proactive approach to asset management.
When added to underground residential distribution transformers, line sensors not only detect faults on the primary side, but they also monitor transformer loading. This loading information helps utility engineers use real system data to improve asset management and replace overloaded assets before they fail. EV charging is increasing the importance of transformer monitoring as a transformer that was appropriately loaded in the past may become overloaded if multiple customers charge EVs simultaneously.
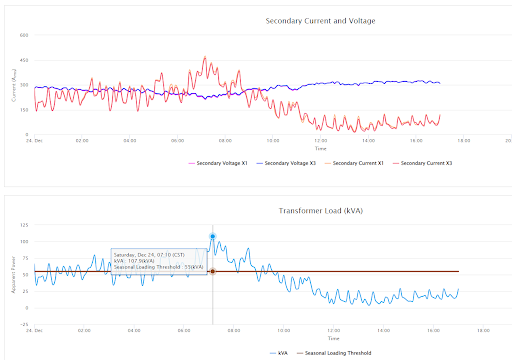
The graph above from a leading Southwestern utility shows line sensor data indicating a transformer that was overloaded. In fact, this transformer was overloaded 150 times in eight months, with an average loading of 126% of its nameplate rating and a peak loading of 212% during this period. When a transformer is overloaded like this, there is not only risk of an outage, but also more severe risk of a transformer catching fire.
If an overloaded transformer is identified and replaced as part of planned equipment upgrades, there are potential savings in CMI and O&M costs, plus reduced legal risk related to fires.
Line sensor load data is available within minutes of sensor installation, so utility system planners can benefit from the information as soon as they integrate the data insights into decisions and work processes.
Value Stream #3 – Anomaly Detection for Proactive Maintenance
The first two sets of line sensing use cases and value streams described here require line sensors and software to collect sensor data, visualize it, and integrate the data into other distribution system management applications such as SCADA, OMS, and DMS.
This third newer, more progressive use case and value stream identifies potential system problems before faults and outages occur — by adding analytics and machine learning to sensor data.
The large amount of data collected when capturing system anomalies, the computing resources required for machine learning, and scalability over time often necessitate that analytics modules be deployed in the cloud. To gain the ROI of this anomaly detection value stream, line sensor data integration software must also be flexible enough to integrate with cloud components.
Anomaly data is typically collected for three to twelve months to establish a baseline and set up a successful start to predicting outages. Line sensors detect waveform anomalies and analytics models driven by machine learning identify those that are precursors to faults caused by vegetation in contact with power lines and equipment failure. Daily reporting alerts utilities to feeder segments with high levels of precursor anomalies so they can take action to preempt faults.
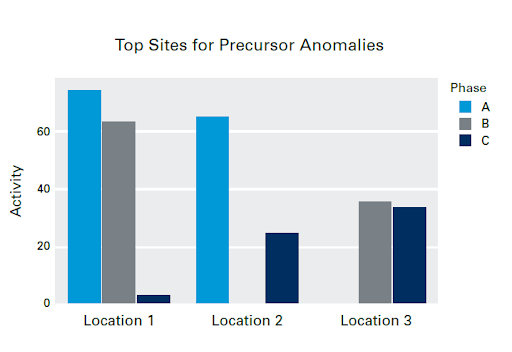
Often the single largest line item of utility O&M budgets, vegetation management costs can exceed $100 million annually for larger utilities. Vegetation management is not new to utilities, but using line sensors and analytics to predict faults associated with vegetation and line contact is. The potential impact of proactively addressing these faults before they lead to a larger issue is exciting.
Machine learning is also proven to be effective in characterizing anomalies that are precursors to equipment failures of insulators, cut outs, lightning arrestors, transformers, etc. Line sensing, data integration, and analytics provide clear indicators of impending equipment failure, allowing utilities to prevent unplanned outages by taking preemptive action.
Preempting outages due to vegetation contact and equipment failure provides significant system average interruption frequency index (SAIFI) improvements and O&M savings. By preventing future outages utilities also improve long term SAIDI metrics.
A Diversified Approach is Most Effective for Improving Reliability
The complexity of today’s distribution grid challenges calls for reliability solutions that improve power delivery in multiple ways. With three sets of use cases and value streams, intelligent line sensing with analytics offers a multi-pronged and quick time-to-value approach to improving reliability now and into the future.
The fault detection and load monitoring value streams provide immediate ROI to operations and system planning teams. These benefits include reduced outage durations and O&M costs, and better, data-informed planning decisions for switching, load balancing, and asset management.
And, while those quick time-to-value benefits are playing out, the third value stream for anomaly detection and proactive maintenance will begin to systematically predict outages before they happen. Achieving high probability prediction takes time and effort, but the potential payback in reliability improvements and customer satisfaction can be a game changer.
When planning your utility’s grid modernization investments, technologies that provide multiple reliability value streams often mean quicker and more easily measured ROI. A multi-pronged reliability solution like line sensing with analytics can balance long term grid modernization investment paybacks with shorter term utility and customer gains.

