

Managing the Grid in the Age of AI and Large Computational Loads
Why Synchro Waveforms Are Becoming Essential
The rapid growth of artificial intelligence developments is reshaping not only computing infrastructure, but also the electrical grid that powers it. As AI data centers and other large IBR-interfaced resources scale to unprecedented levels, they introduce new electrical behaviors that challenge traditional grid management and stability practices.
This blog explores why large AI loads are different, the risks they introduce, and why a new class of measurements based on synchro waveforms and associated analytics is emerging as a necessary tool for enhanced grid visibility, situational awareness, and reliability.
A Structural Shift in Electricity Demand Behavior
Data centers are already a significant and growing part of electricity consumption in the United States and globally. Estimates from Lawrence Berkeley National Laboratory show they accounted for roughly 4–5% of U.S. electricity demand in the early 2020s, with projections suggesting 6–12% by the end of the decade under high-growth scenarios [1].
This growth is increasingly driven by AI workloads. Unlike traditional applications, AI training introduces highly coordinated and synchronized computing patterns, which translate directly into new types of electrical demand behavior. Conventional data centers process diverse and independent workloads. The resulting power demand is relatively smooth because fluctuations across tasks tend to cancel out.
AI training environments behave differently because:
- Large GPU clusters operate in parallel
- Workloads are tightly synchronized
- Power demand rises and falls simultaneously across racks
- Alternating compute and communication phases create periodic load changes
These synchronized operations produce coherent, periodic oscillations in power demand, rather than the smoothed profiles utilities are used to seeing. At scale, this transforms data centers from passive predictable loads into active participants in grid dynamics.
The Hidden Risk: Forced Oscillations Across Frequencies
Bulk power systems continuously experience small perturbations, such as routine load variations, which excite their inherent dynamic characteristics. As a result, they naturally oscillate at their characteristic frequencies, known as natural, system, or modal oscillations. These oscillations are generally benign and are effectively managed through system design and damping mechanisms.
In contrast, forced oscillations are driven by external sources that continuously inject energy into the system. They can occur at any frequency, any time, and any place where an external driving function may exist. Common causes include equipment malfunctions, adverse control-system interactions, poorly tuned controllers, or abnormal operating conditions. Unlike natural oscillations, which occur at the system’s inherent frequencies, forced oscillations occur at the frequency of the external disturbance and can pose significant reliability challenges if not identified and mitigated.
Forced oscillations are typically not predictable and identified through the analysis of dynamic measurement data, such as PMU recordings, rather than through conventional modal analysis or transient stability studies. This is because forced oscillations originate from external periodic disturbances and may not be captured by models that focus solely on the system’s inherent dynamic characteristics.
The reliability challenges posed by forced oscillations in power systems are not new and established frameworks already exist at the bulk power system level to monitor, identify, and mitigate such oscillations. Several examples to highlight the growing relevance of this issue include the following [2].
In 2017, Meta’s data centers experienced oscillations at 49 Hz and 71 Hz, which were attributed to voltage control interactions within server power supply units. In October 2024, Texas grid operators observed 23 Hz oscillations in real power measurements near a large electronic load; these oscillations diminished as active power demand decreased.
More recently, Dominion Energy reported 14.7 Hz oscillations with a peak-to-peak magnitude of approximately 4% in voltage measurements at a 115 kV substation serving a data center region. The oscillations occurred when four nearby hydroelectric generating units reduced their output. The source of the oscillations was determined to be the data center’s uninterruptible power supply systems.
The oscillatory behavior of AI data center loads can interact with the grid in complex ways. These effects span a broad frequency range from very low-frequency system modes to high-frequency mechanical interactions. At lower frequencies, namely 0.1-1 Hz active power oscillations can interact with inherent grid modes such as inter-area oscillations. If aligned in frequency, they can:
- Amplify existing oscillations through resonance
- Increase stress on transmission corridors
- Trigger protection systems due to large power swings
At higher frequencies typically 5-59 Hz, the risk shifts toward mechanical effects:
- Interaction with generator shaft torsional modes
- Repeated excitation leading to cyclic torque
- Potential long-term fatigue in rotating equipment
Together, these unwanted interactions create both operational risks and asset reliability concerns. Recognizing these risks, many utilities, ISOs, and RTOs have begun to develop and enforce compliance requirements specifically around frequency and magnitude of the forced power oscillations. The recent issuance of a Level 3 NERC Alert in May highlights the growing risks associated with the interaction of existing and emerging large computational loads with the bulk power system [3]. As data centers and other high-density computing facilities continue to expand, their unique operating characteristics can introduce new reliability challenges, underscoring the need for enhanced monitoring, modeling, and mitigation strategies.
When Most Existing Measurement Systems Fall Short
Phasor Measurement Units (PMUs) and PMU-enabled IEDs (Intelligent Electronic Devices) have become the backbone of wide-area monitoring, protection, and control (WAMPAC) systems. However, most were designed primarily for low-frequency electromechanical dynamics in traditional grids. Their limitations become clear in the context of AI & IBR-driven oscillations. According to IEEE/IEC standard 60255-118-1, commercial PMUs are tested for a limited range of dynamic performance metrics:
- Limited frequency accuracy range
- P-class PMUs: validated up to ~2 Hz
- M-class PMUs: validated up to ~5 Hz
- Sampling constraints
Typical reporting rates (30–120 frames per second) limit observable frequency content theoretically guided by the Nyquist limit. - Filtering and aliasing effects
Anti-aliasing filters prior to digitization suppress higher-frequency components by design and misrepresents the true system behavior
As a result, higher-frequency power oscillations are often attenuated, distorted, or completely mischaracterized in traditional phasor data as demonstrated in a recent report from PNNL [4].
The Case for Synchro Waveform Measurements
To address these limitations, high-resolution waveform-based data acquisition devices and systems -often referred to as synchro waveforms (SWF) or point-on-wave (POW) measurements are gaining attention [5]. Unlike phasor-based approaches, waveform measurements:
- Capture the full electrical signal without abstraction
- Preserve both frequency and magnitude accuracy
- Enable analysis across a wide frequency range, including sub-synchronous bands
This is particularly important because phasor-domain observations often mask underlying waveform dynamics. For example, what appears as a simple oscillation in phasor data may correspond to more complex spectral behavior in the waveform domain. Moreover, many sub-cycle events and disturbances simply do not show up beyond the noise levels in phasor measurements that require at least a few power cycles for computations.
Practical Challenges to Address
Despite their advantages, synchro waveform approaches come with implementation hurdles:
- Large volumes of high-frequency data
- Communication bandwidth requirements
- Real-time processing demands
- Storage and system integration complexity
These challenges underscore the need for optimized measurement strategies and intelligent data reduction techniques.
A Practical Path Forward: Tiered Architecture
While waveform data provides superior visibility into system transients, its widespread deployment introduces significant challenges related to data volume, communication bandwidth, storage, and computational requirements. To balance analytical accuracy with practical scalability, a tiered architecture is needed. Such an approach combines the efficiency of edge analytics for local data processing and event detection with the scalability, flexibility, and elastic resources of cloud-based computing and storage.
Localized High-Resolution Tracking
- Deployed at data center interconnection points and strategic locations along the feeders
- Detects oscillations in real time and by exception
- Enables proactive mitigation (e.g., workload adjustments)
Coordinated System-Level Tracking
- Avoids continuous transmission of raw waveform data
- Shares processed insights with utilities and operators
This distributed framework enables timely insights while managing the operational demands of large-scale synchro-waveform data collection and analysis.
A Scalable Solution to Leverage Synchro-Waveforms for High Frequency Oscillation Detection and Analysis
Intelligent line sensors and their associated data platforms have become essential components of grid modernization, offering unique capabilities that position them as a scalable solution for high frequency wide-area oscillation detection. Installed at strategic locations along distribution feeders and near large loads, these sensors harvest power inductively from the circuit itself, operate autonomously, and measure electric field strength as a proxy for voltage, along with line current and other key system variables, all with GPS-synchronized time precision.
Complementing traditional SCADA and PMU systems, intelligent line sensors leverage embedded analytics and local processing to enhance real-time visibility and situational awareness across the grid. This architecture enables the localized detection of feeder events, including oscillations, faults, and other disturbances, while reducing the need for costly communications and infrastructure upgrades. As a result, utilities can expand monitoring coverage and improve grid observability in a cost-effective and scalable manner.
Intelligent line sensors can be configured to capture and communicate time-synchronized oscillography data either on demand or automatically in response to faults and other system disturbances. This waveform data commonly referred to as synchro-waveforms, enable a variety of advanced applications, including the detection and analysis of high-frequency forced oscillations.
To complete the picture, selected sensor data from the field can be securely transmitted to a centralized analytics platform that provides enhanced computing, storage, and AI-driven analytical capabilities. This head-end platform enables utilities to visualize, analyze, and process large volumes of high-resolution data, separating noise from meaningful system behavior and identifying potential oscillatory events that could impact grid reliability, stability, and performance.
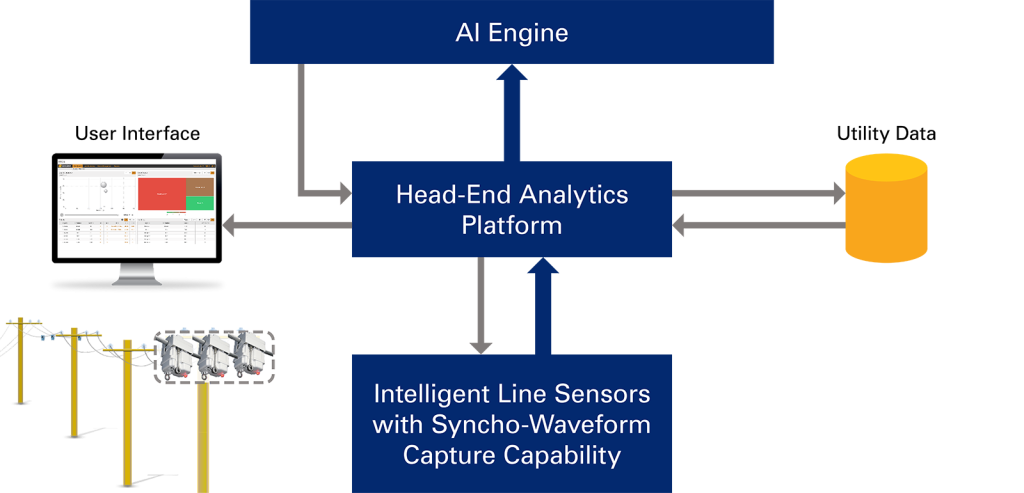
Figure 1: Solution Architecture
An example oscillation event captured across three sites within a few miles of one another in the Western US is shown below. The measurements indicate a forced oscillation at approximately 3 Hz. In the first oscillation cycle, the peak-to-peak magnitudes reached 80%, 105%, and 107% relative to the corresponding pre-event active power magnitudes at Sites 1, 2, and 3, respectively. This event is believed to have been associated with a hydroelectric generating facility operating near full output while the reservoir water levels were below the recommended operating range. The oscillation was observed simultaneously across multiple locations, demonstrating the ability of the sensor network to detect and characterize wide-area grid disturbances.
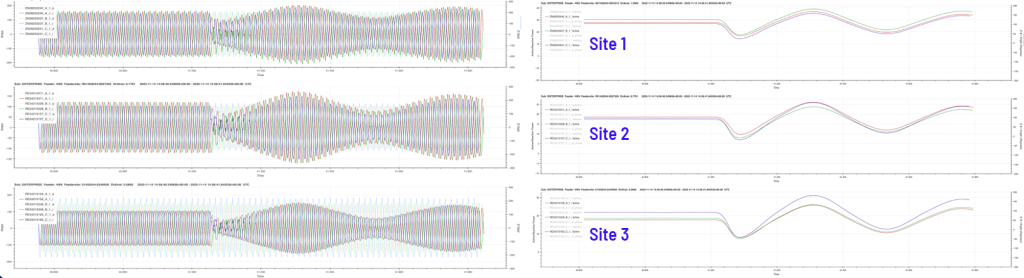
Figure 2: 3Hz Power Oscillation Observed Near a Hydroelectric Generating Facility
Another recent power oscillation event affecting a large geographic area is illustrated below. The event occurred on June 4, at approximately 19:34:00 Central Time and was observed across multiple locations with oscillation frequency around 7Hz. At the time of this writing, the root cause remains under investigation. The widespread nature of this disturbance highlights the importance of high-resolution, geographically distributed synchronized measurements for the detection and characterization of such oscillations.
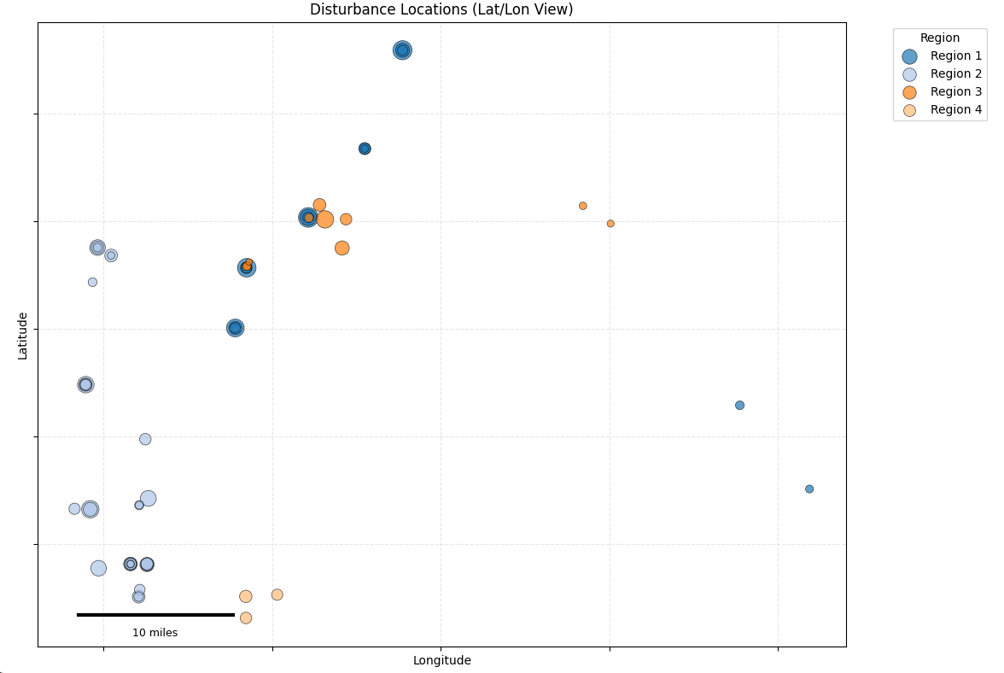
Figure 3: June 4 Oscillation Event Detected Across a Large Area
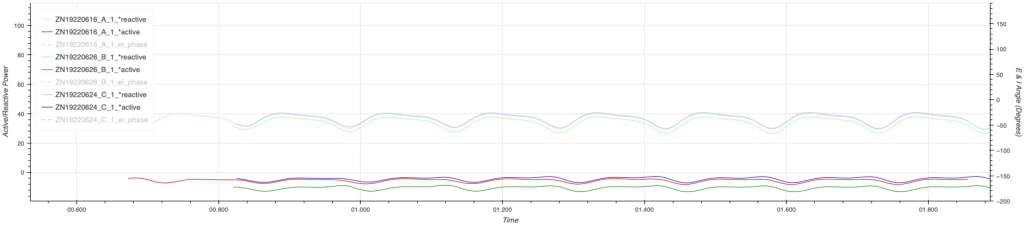
Figure 4: Real and Reactive Power Oscillations Observed on June 4th
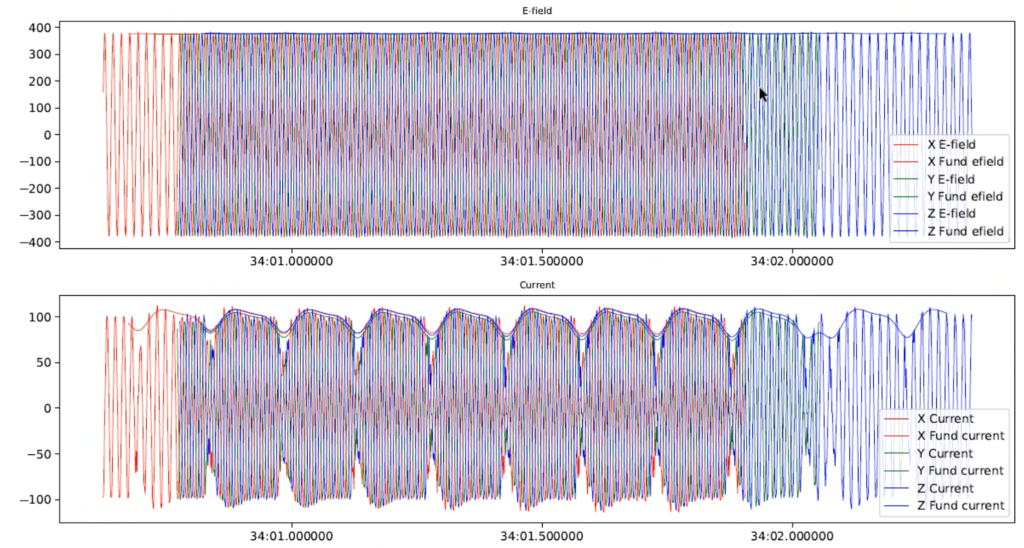
Figure 5: Current and E-Field Synchro-Waveforms
Final Thoughts
AI data centers and large computational loads are changing the nature of electrical demand in ways that extend beyond simple load growth. Their synchronized, oscillatory behavior introduces new interactions with power system dynamics, many of which fall outside the observable range of traditional SCADA and PMU measurements.
Direct synchro-waveform measurements provide a path to closing this visibility gap. Coupled with hybrid and distributed architectures, the technology enables operators to detect, interpret, and respond to emerging high frequency power disturbances.
As AI and large computational load infrastructure continue to expand, adopting efficient and scalable measurement and analytics solutions will be critical to ensuring grid stability, regulatory compliance, and long-term asset and system reliability. The unanswered questions and gaps in our understanding of grid-load interactions are often where the most interesting discoveries begin.
For Further Reading:
- A. Shehabi, A. Newkirk, S. Smith, A. Hubbard, N. Lei, M. Abu Bakar Siddik, B. Holecek, J. Koomey, E. Masanet, and D. Sartor, “United States Data Center Energy Usage Report”, Lawrence Berkeley National Laboratory, 2024.
- L. Fan, A. Yazdanpanah, Y. Cheng, Z. Miao, F. Salehi, P. Gravois, and S. Huang, “Replicating Real-World 23-Hz Oscillations Caused by Large Electronic Loads”, IEEE PES IBR/IBL SSO Task Force, May 2026.
- https://www.nerc.com/newsroom/nerc-issues-level-3-alert-reliability-guideline-focused-on-large-load-challenges
- K. Chatterjee, J. Follum, A. Varghese, S. Biswas, E. Farantatos, and L. Zhu, “Measurement Adequacy for Monitoring Data Center Oscillations”, PNNL-39191, April 2026.
- IEEE PES Technical Report PES-TR127, “Synchro-Waveform Measurements and Data Analytics in Power Systems”, December 2024.
